Horse Lake Rainbow Trout Natural and Fishing Mortality Analysis 2017
The suggested citation for this analytic report is:
Dalgarno, S.I.J. and Thorley, J.L. (2018) Horse Lake Natural and Fishing Mortality Analysis 2017. A Poisson Consulting Analysis Report. URL: https://www.poissonconsulting.ca/f/168266338.
Background
Horse Lake supports a recreational fishery for stocked Rainbow Trout and Kokanee and wild Lake Trout. To provide information on the natural and fishing mortality, Lake Trout were caught by angling and tagged with acoustic transmitters and/or reward tags.
Methods
Data Preparation
The outing, receiver deployment and fish capture and recapture information were provided by the Ministry of Forests, Lands and Natural Resource Operations.
The data were imported into a custom SQLite database and manipulated for plotting using R version 3.4.3 (R Core Team 2017).
Data Assumptions
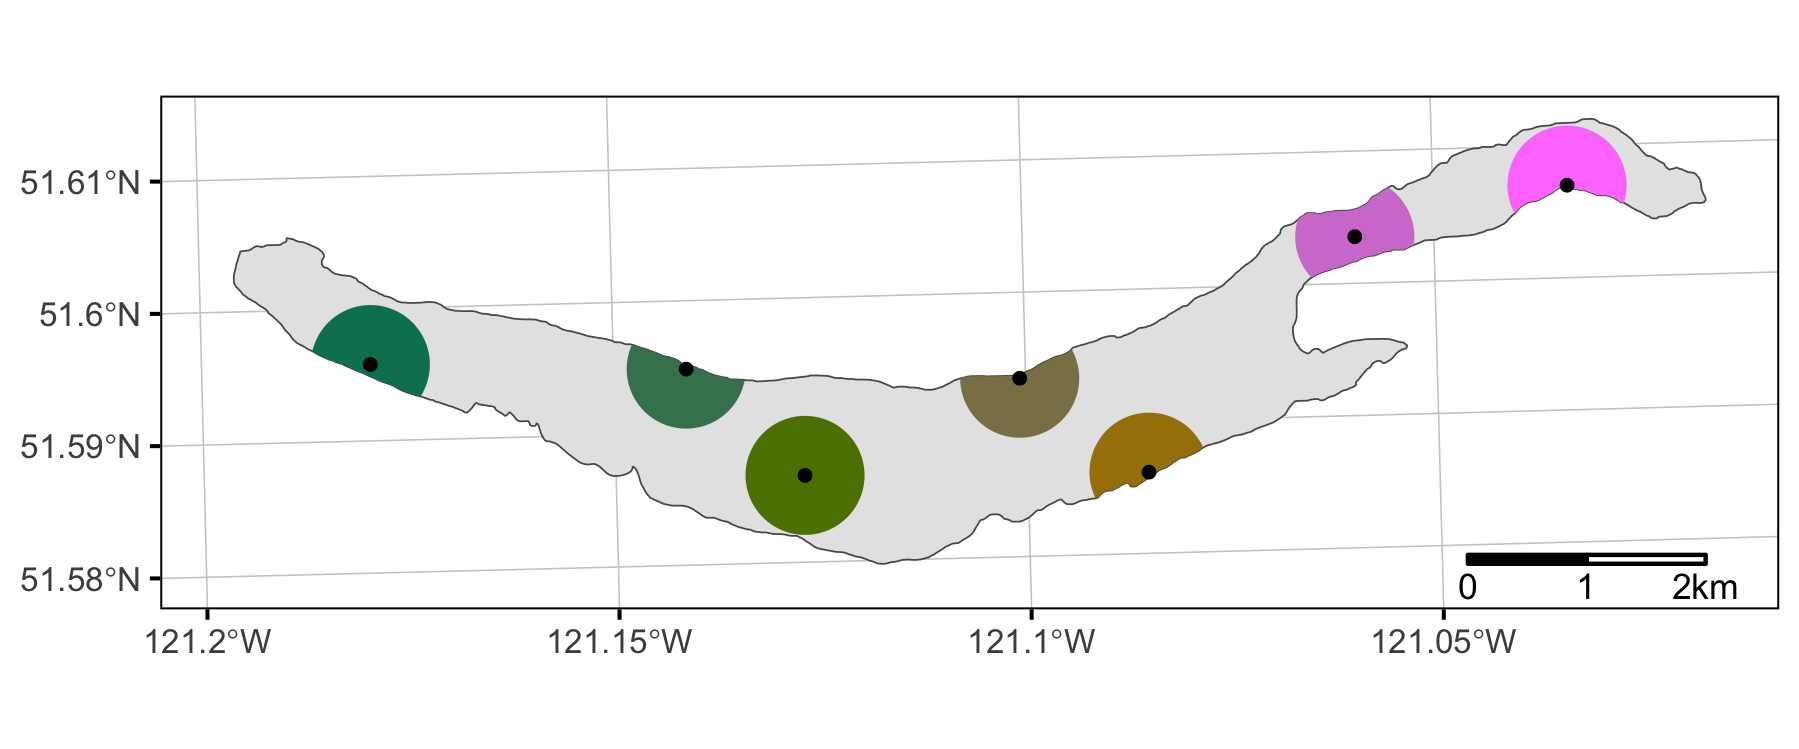
Receivers were assumed to have a detection range of 500 m. Seasons were defined as: December - February (Winter); March - May (Spring); June - August (Summer); September - November (Autumn).
Results
Tables
Captures
Table 1. Number of fish captured by year, species and size class. Any fish > 500mm is classified as ‘large’.
| Year | Species | Large | Small | Total |
|---|---|---|---|---|
| 2017 | Kokanee | 0 | 23 | 23 |
| 2017 | Lake Trout | 7 | 154 | 161 |
| 2017 | Rainbow Trout | 0 | 3 | 3 |
| Total | 7 | 180 | 187 |
Recaptures
Table 2. Recapture rate (total tagged fish/recaptured fish).
| Fish Captured and Tagged | Fish Recaptured | Recapture Rate |
|---|---|---|
| 150 | 2 | 0.01 |
Table 3. Recaptures to date.
| Date Capture | Species | Fork Length (mm) | Date Recapture | External Tag Number 1 | External Tag Number 2 | Harvested |
|---|---|---|---|---|---|---|
| 2017-05-20 | Lake Trout | 405 mm | 2017-09-08 | 86 | 337 | Yes |
| 2017-06-06 | Lake Trout | 445 mm | 2017-07-07 | 278 | 544 | Yes |
Figures
Captures
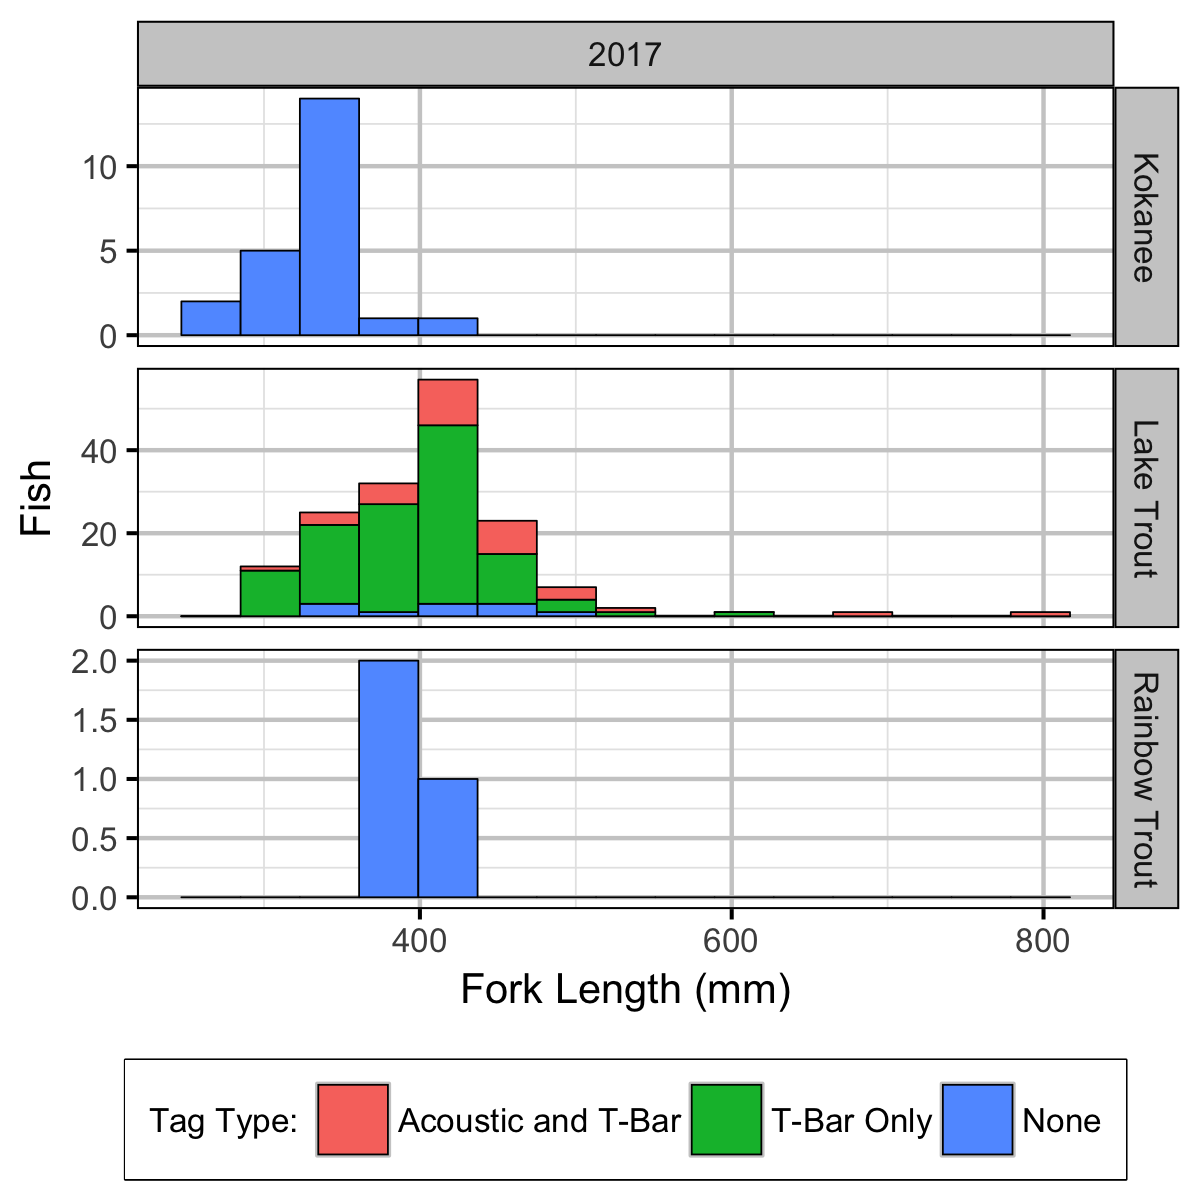
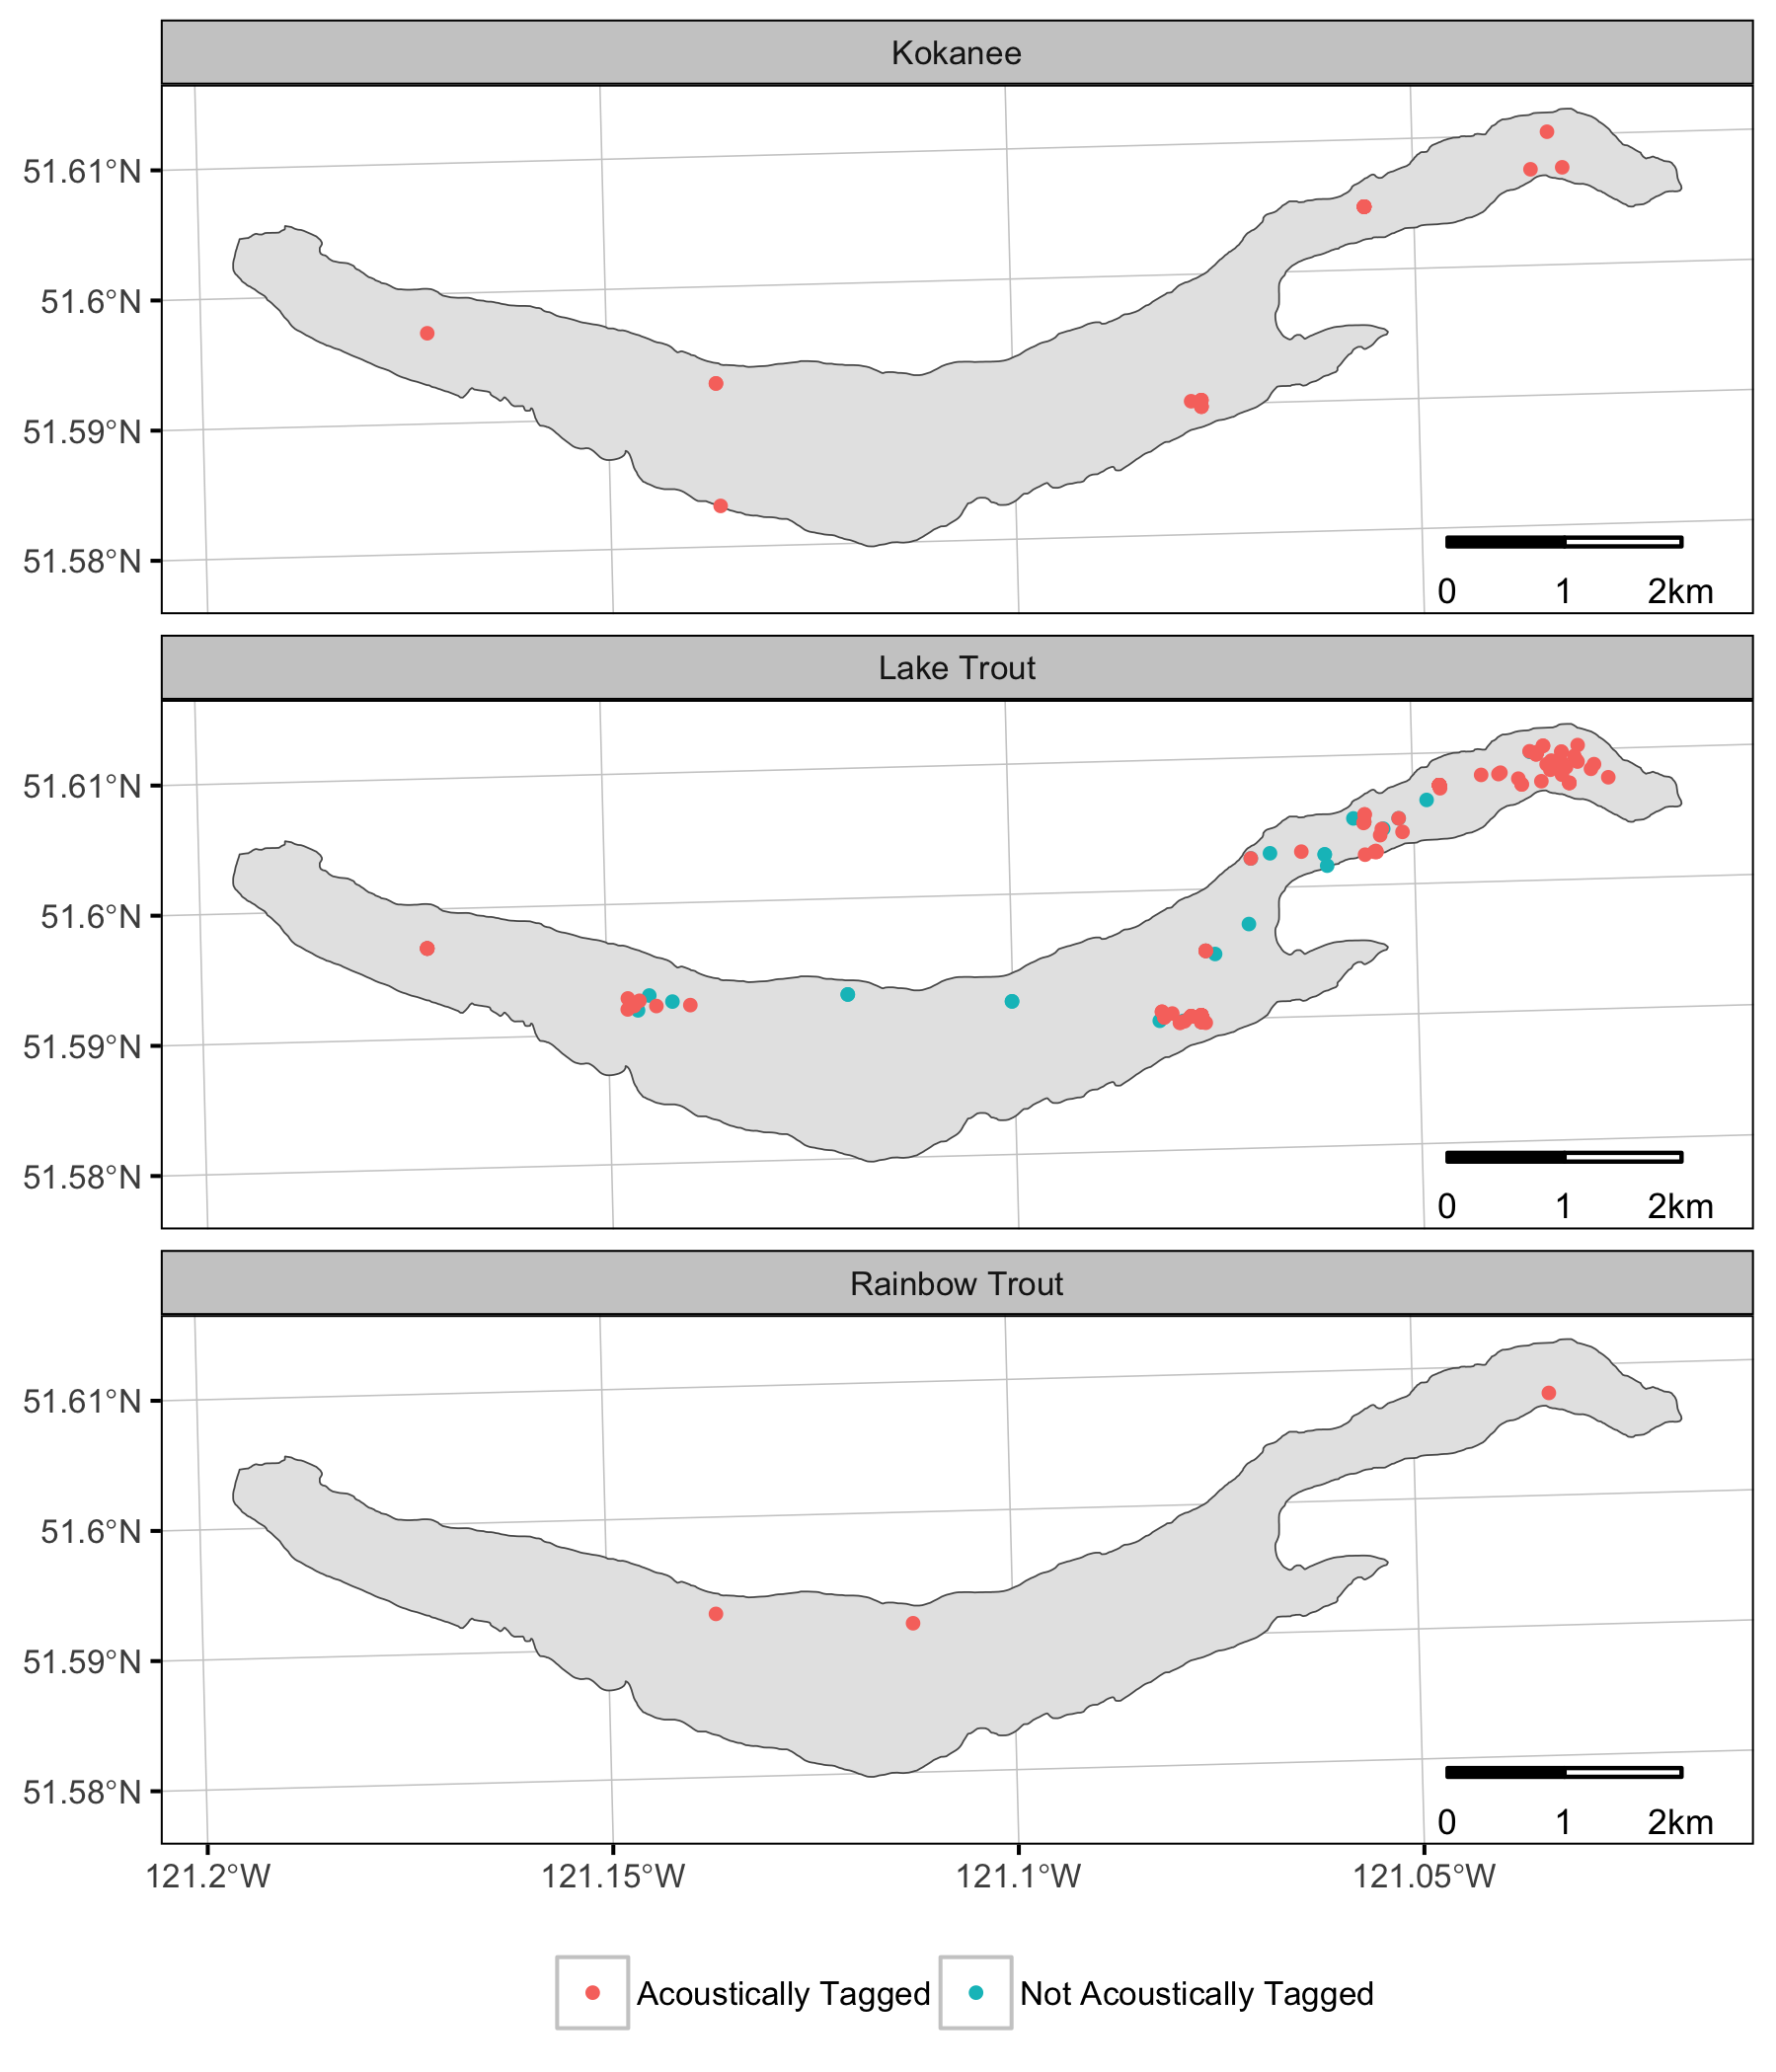
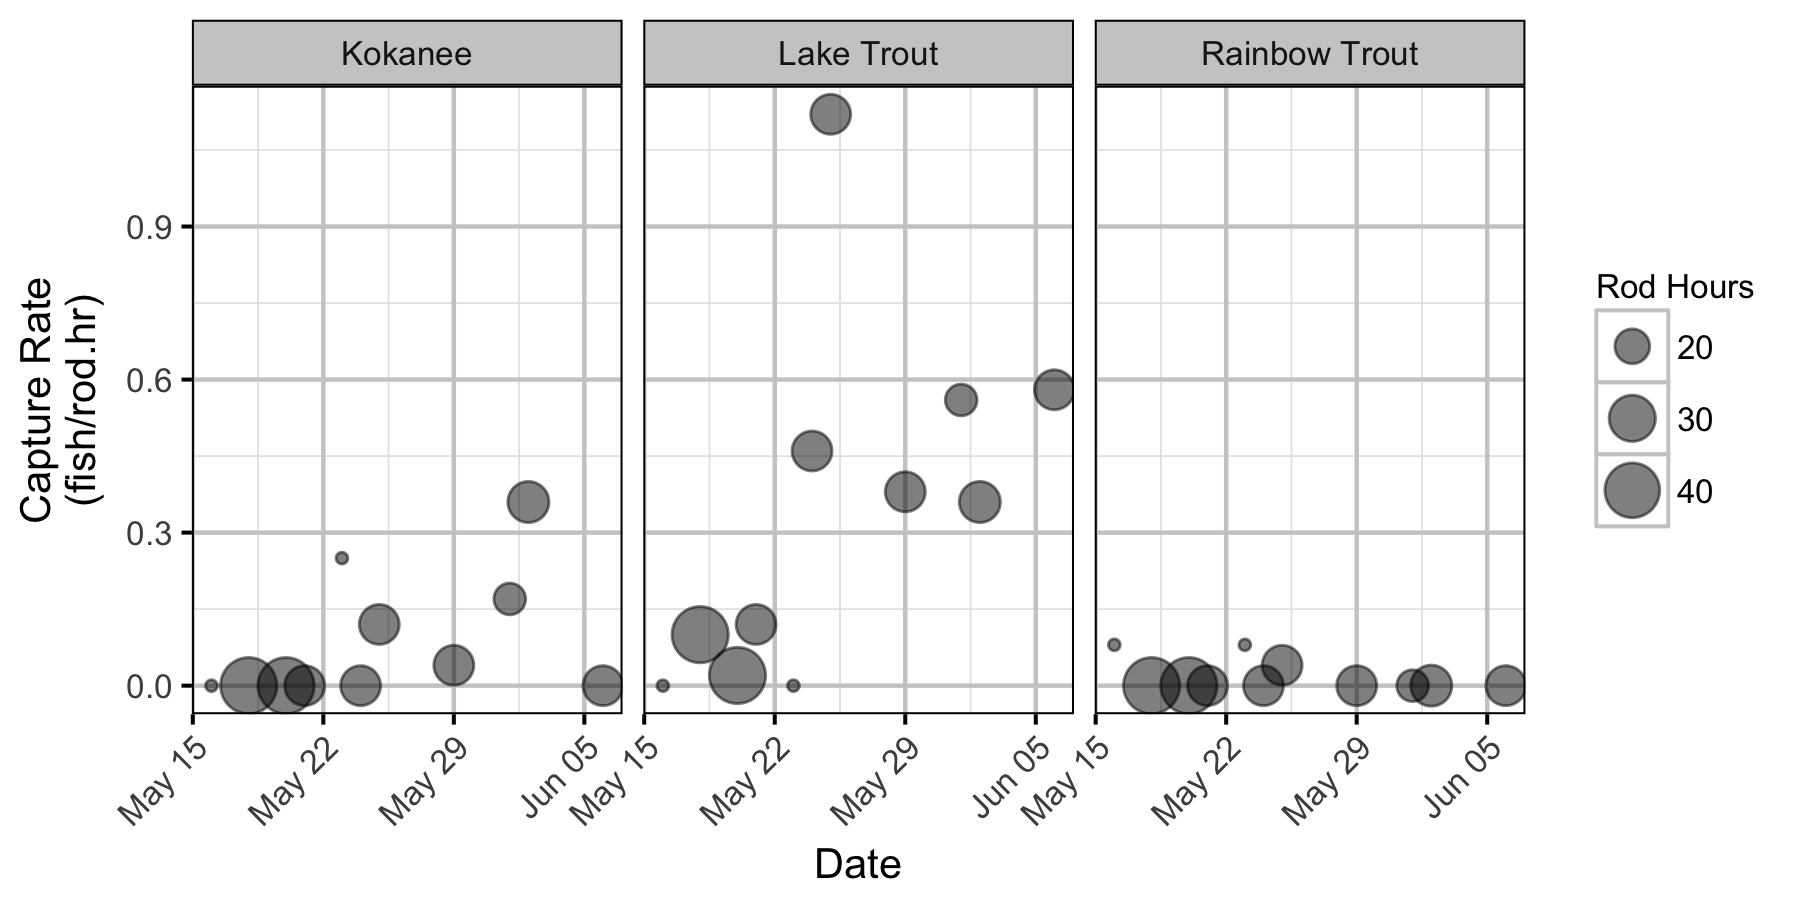
Receiver Coverage
Detections
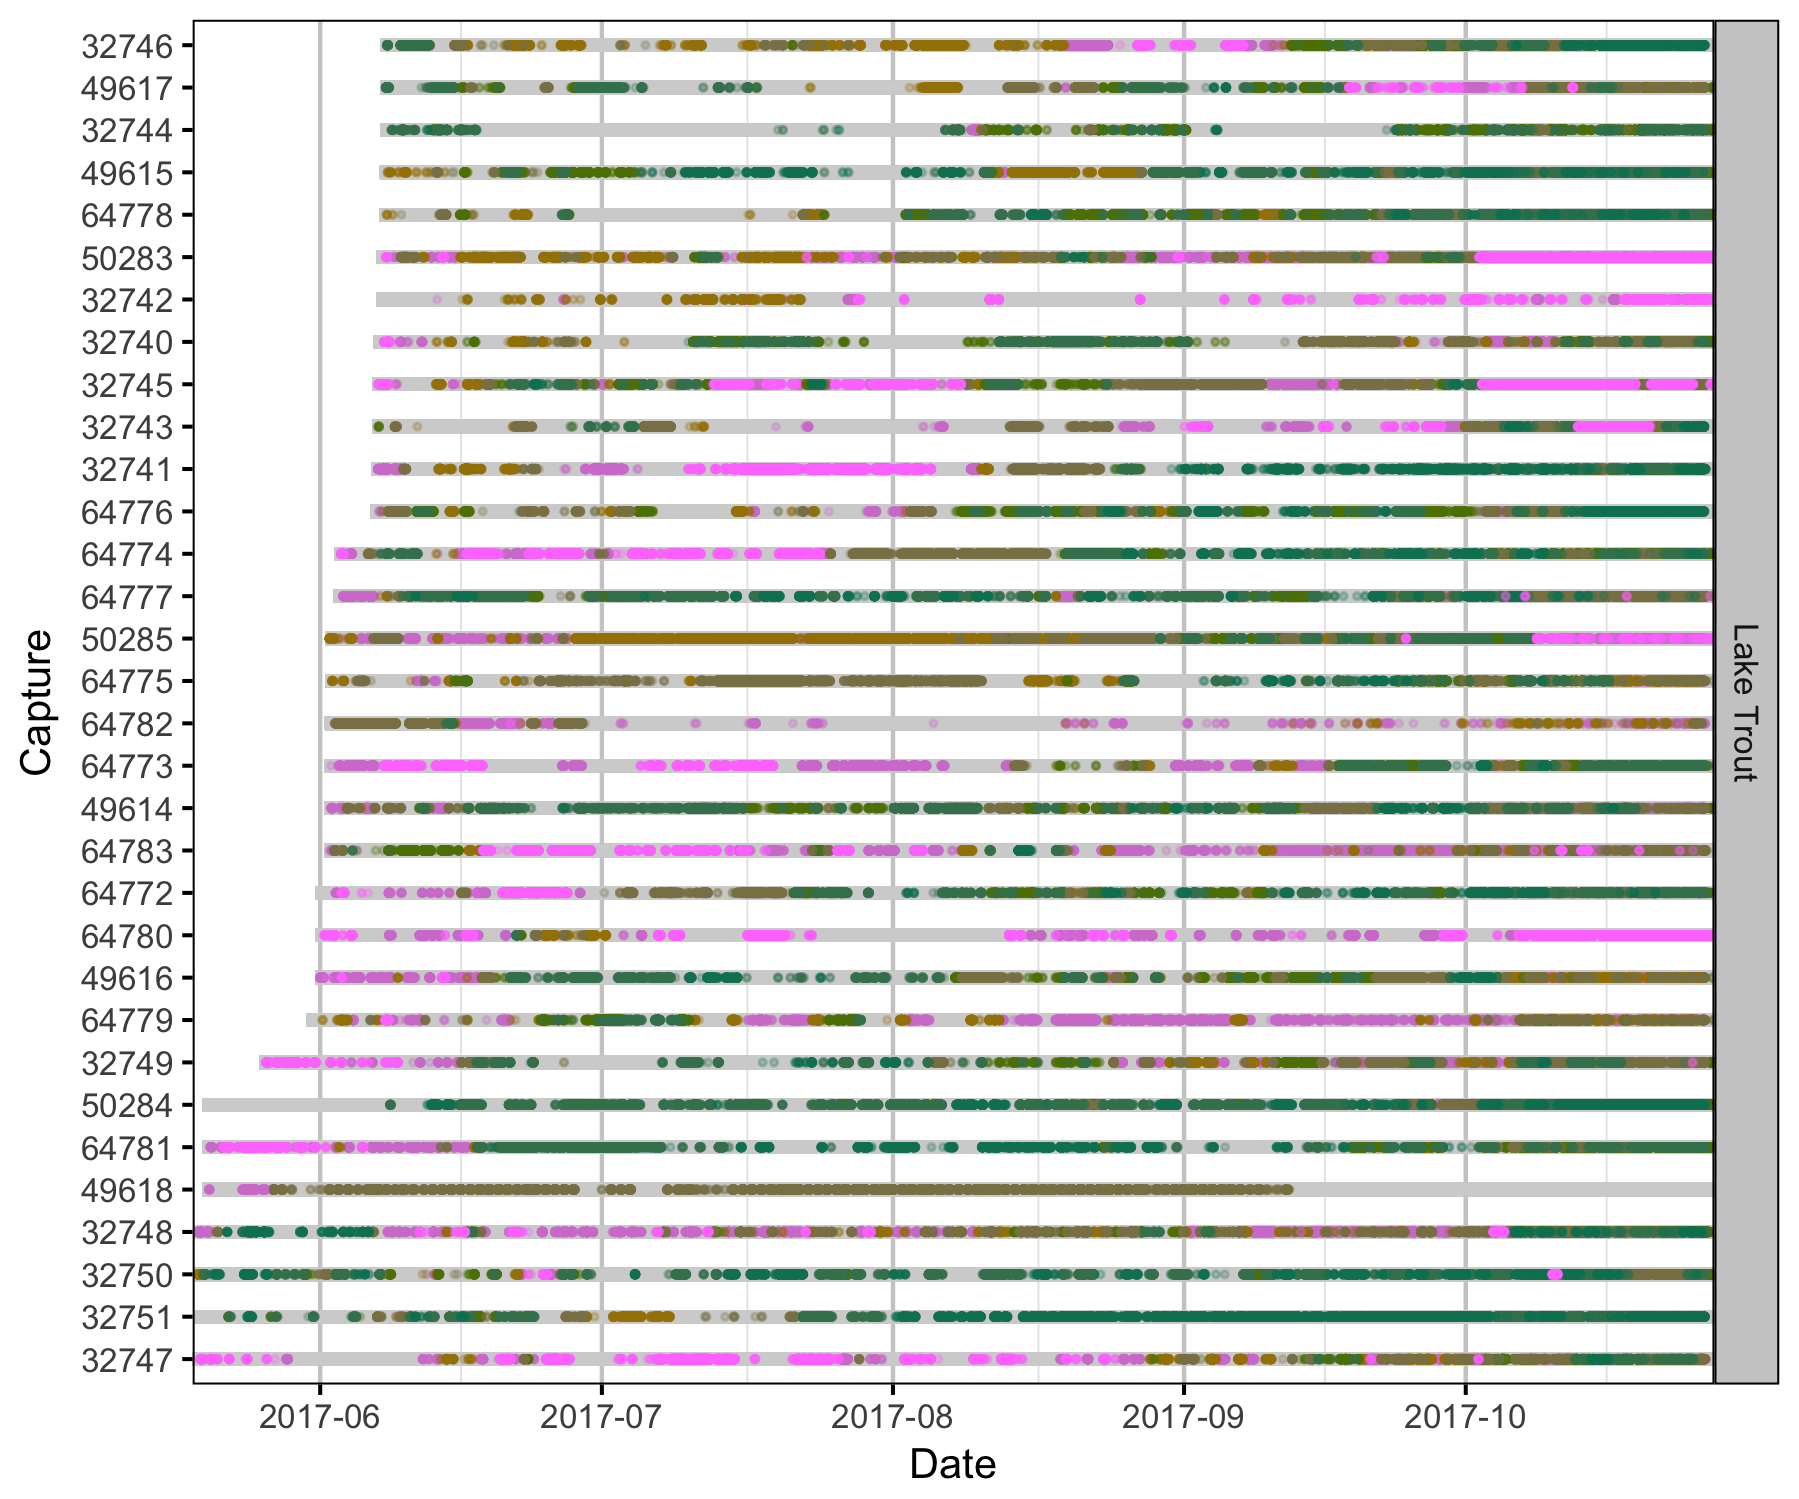
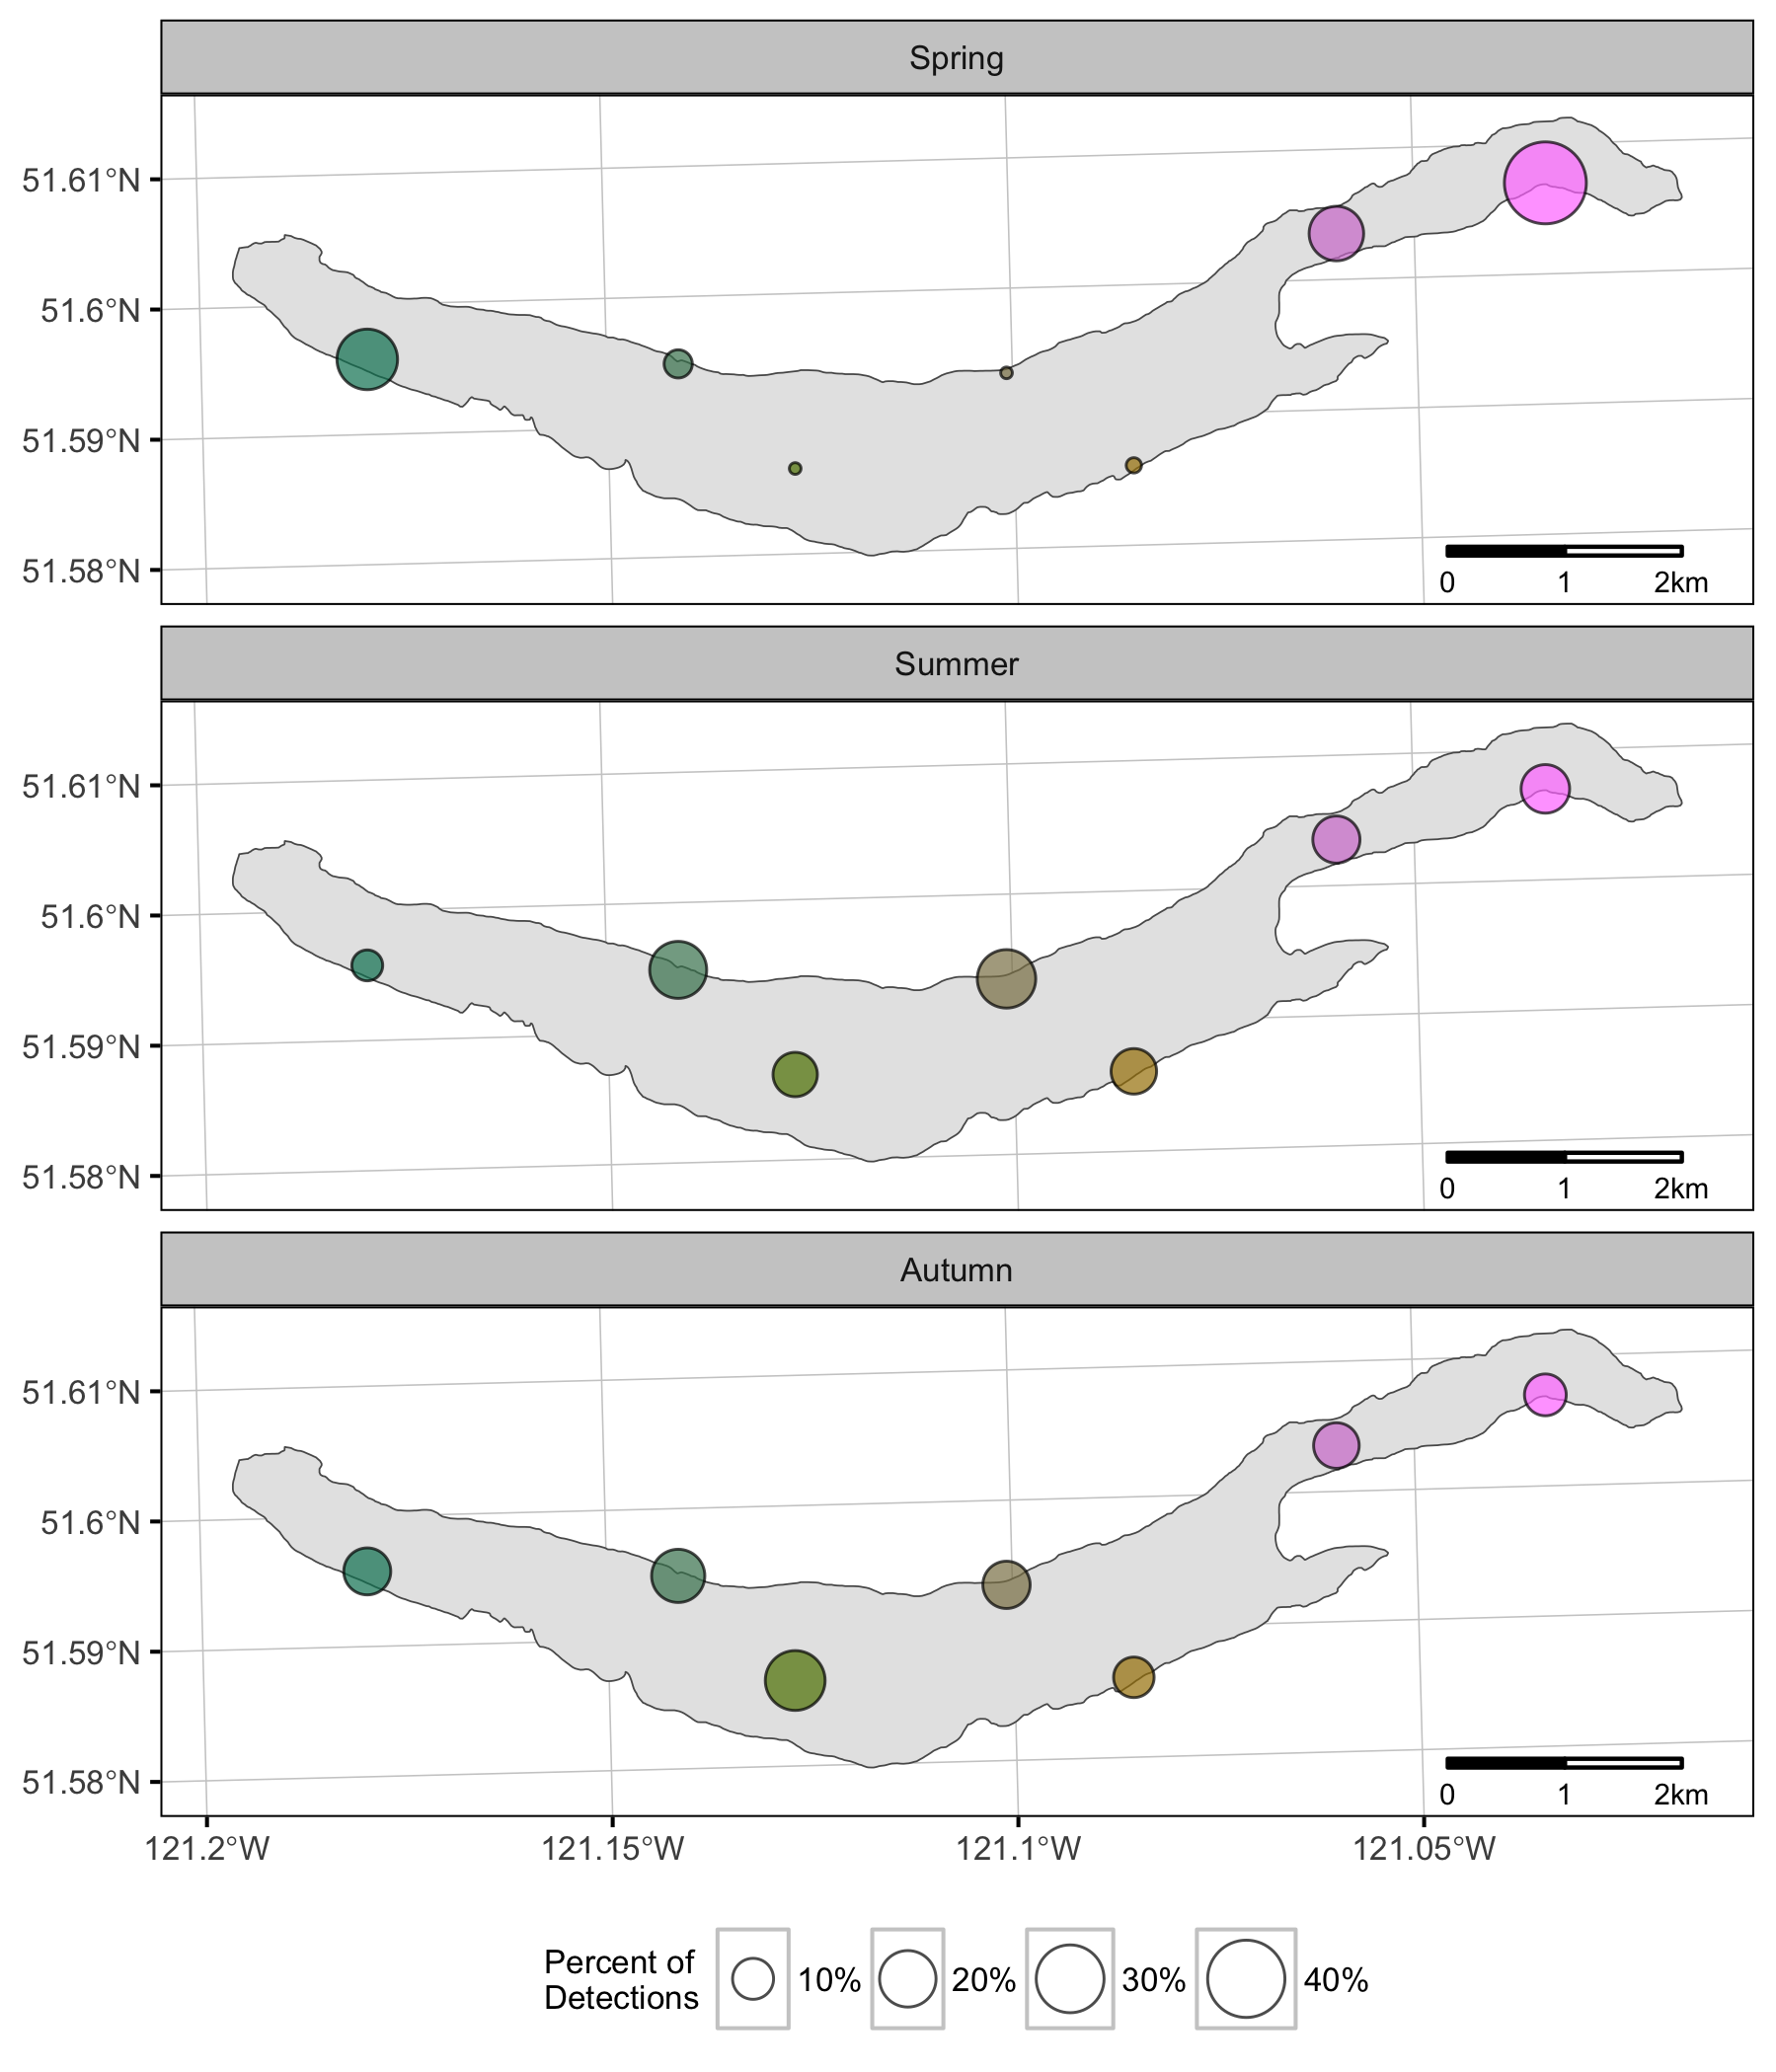
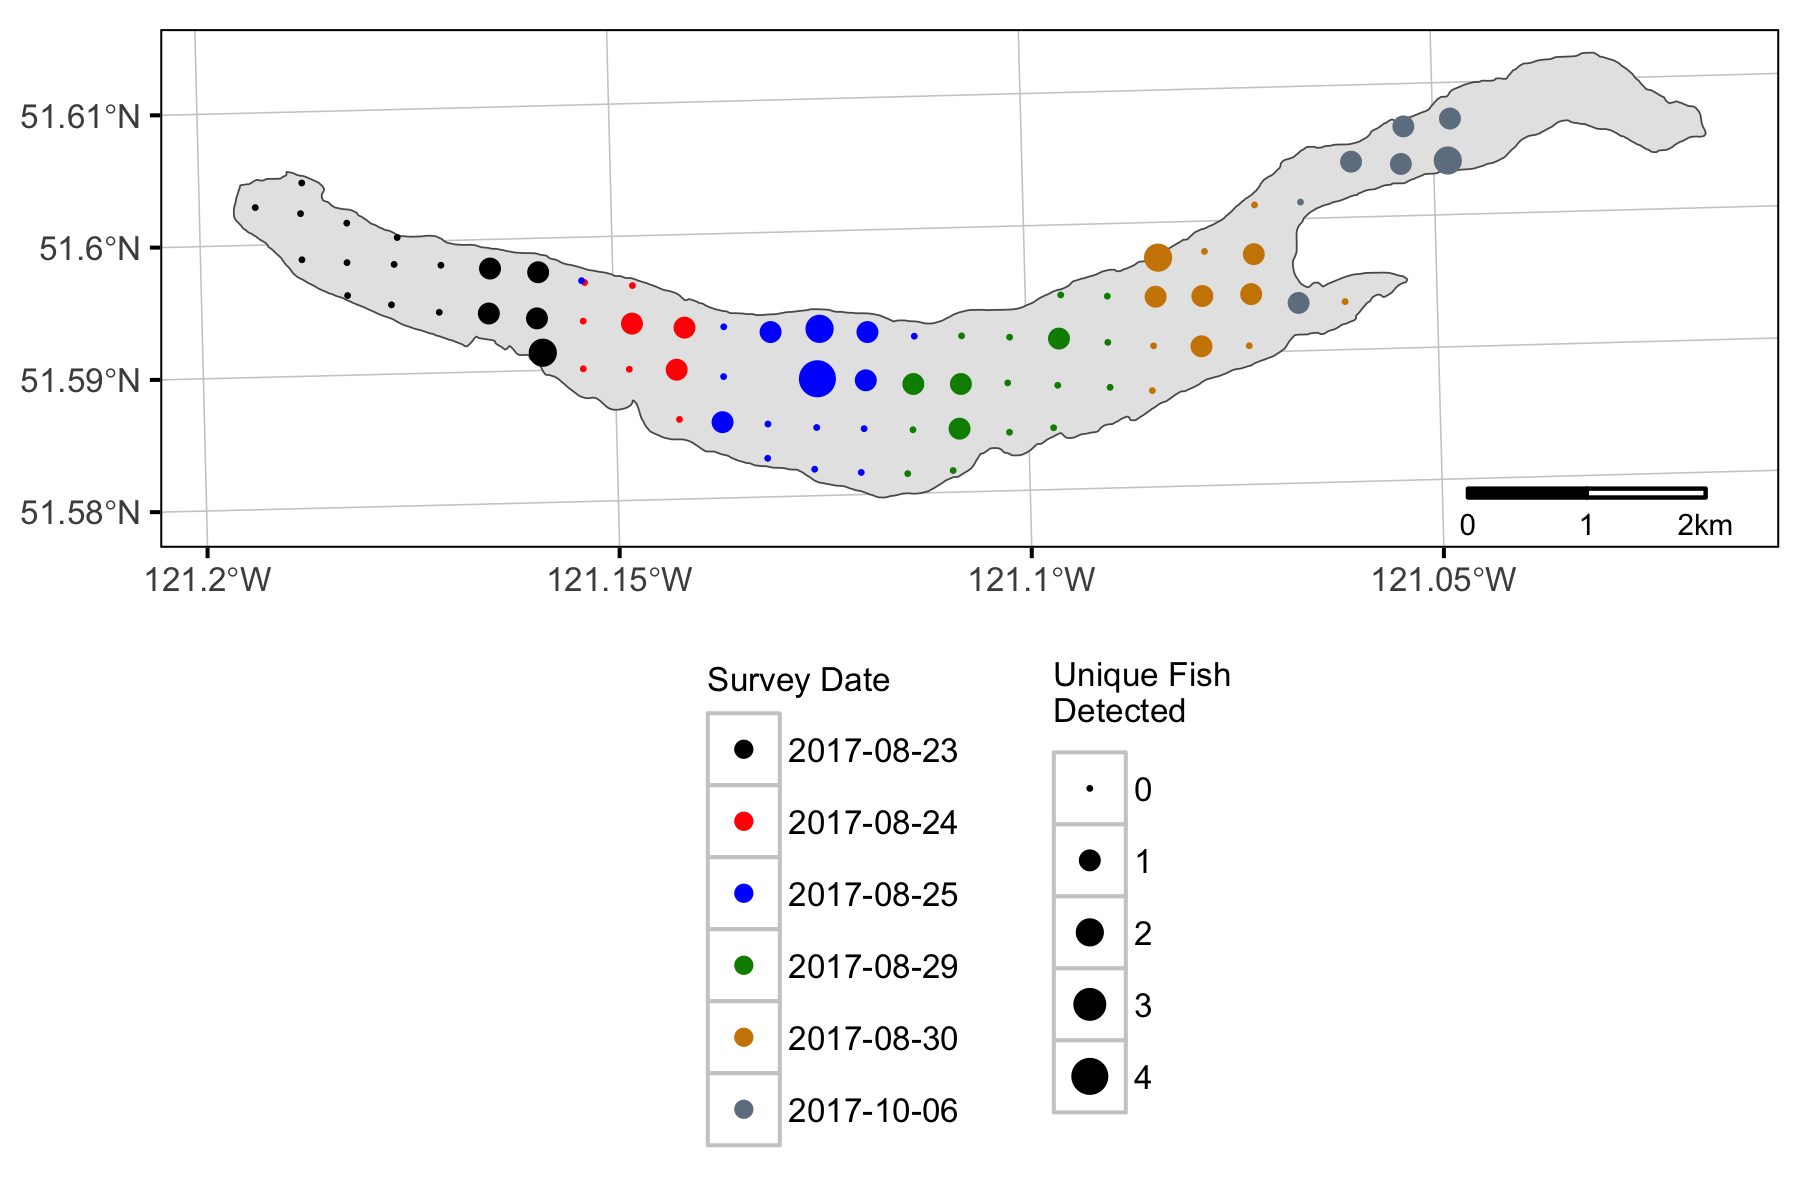
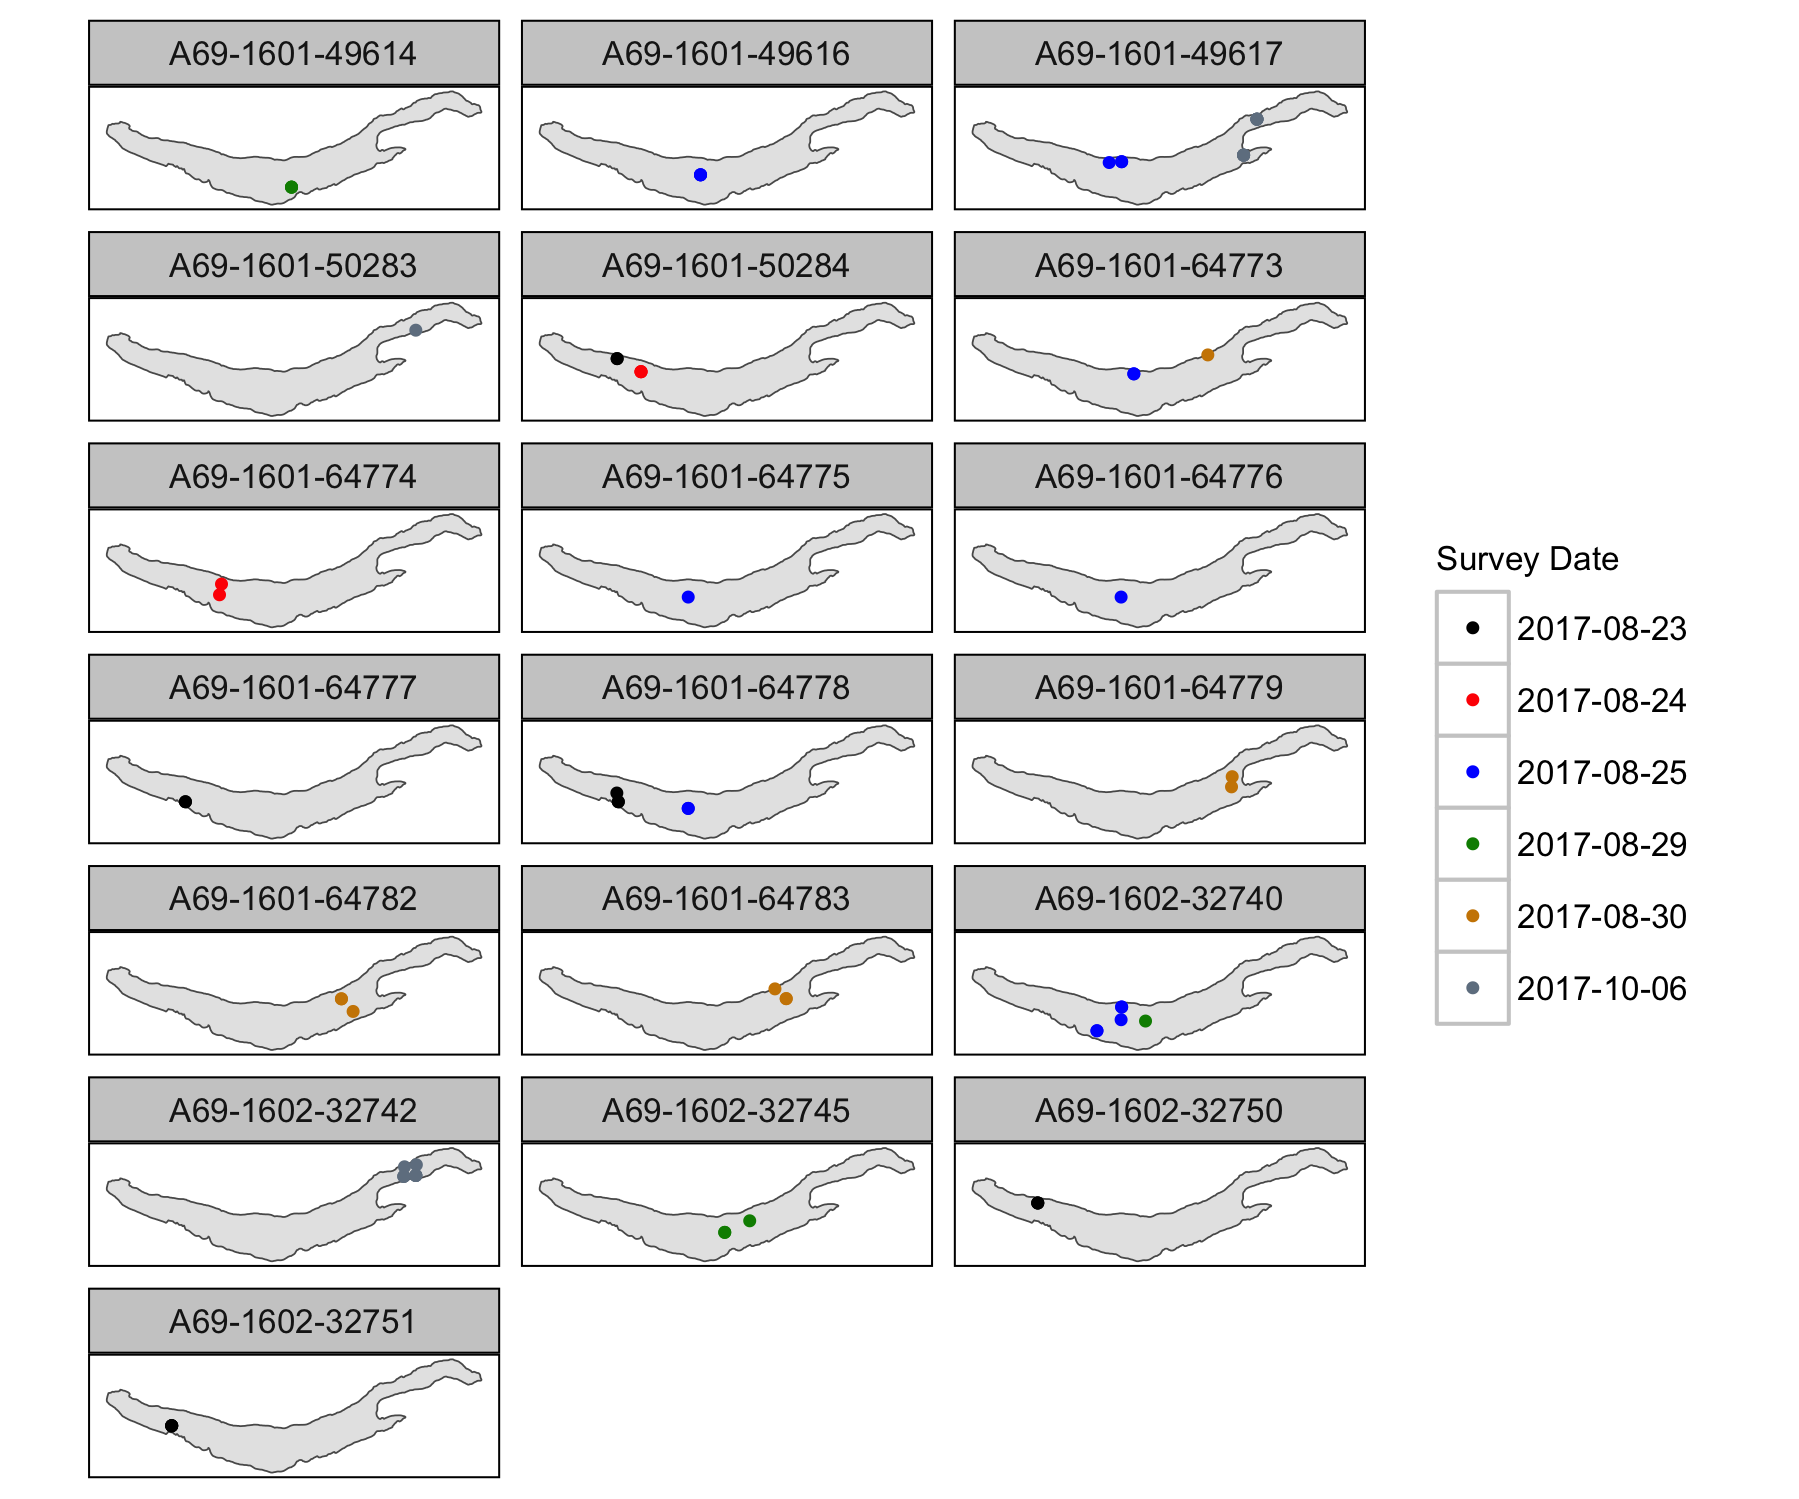
Mobile Survey
Recommendations
- Data management
- Record X/Y coordinates for all captures.
- Record boat for all outings and fish.
- Record start and end time for all outings.
- Record ‘activity’ for all outings (Capture or Deployment).
- Record ‘capture method’ for all captures (Rod or Net).
- Use consistent factor levels (e.g. boat names, capture method).
- Use https://poissonconsulting.shinyapps.io/horse-exploit-upload/ to upload future detection, capture, outing and recapture data.
- Mobile survey
- Mobile surveys should be conducted every three months and each should be finished within a week.
Acknowledgements
The organisations and individuals whose contributions have made this analysis report possible include:
- Ministry of Forests, Lands and Natural Resource Operations
- Russell Bobrowski
- Scott Horley
References
R Core Team. 2017. “R: A Language and Environment for Statistical Computing.” Vienna, Austria: R Foundation for Statistical Computing. https://www.R-project.org/.