Species Sensitivity Distributions App
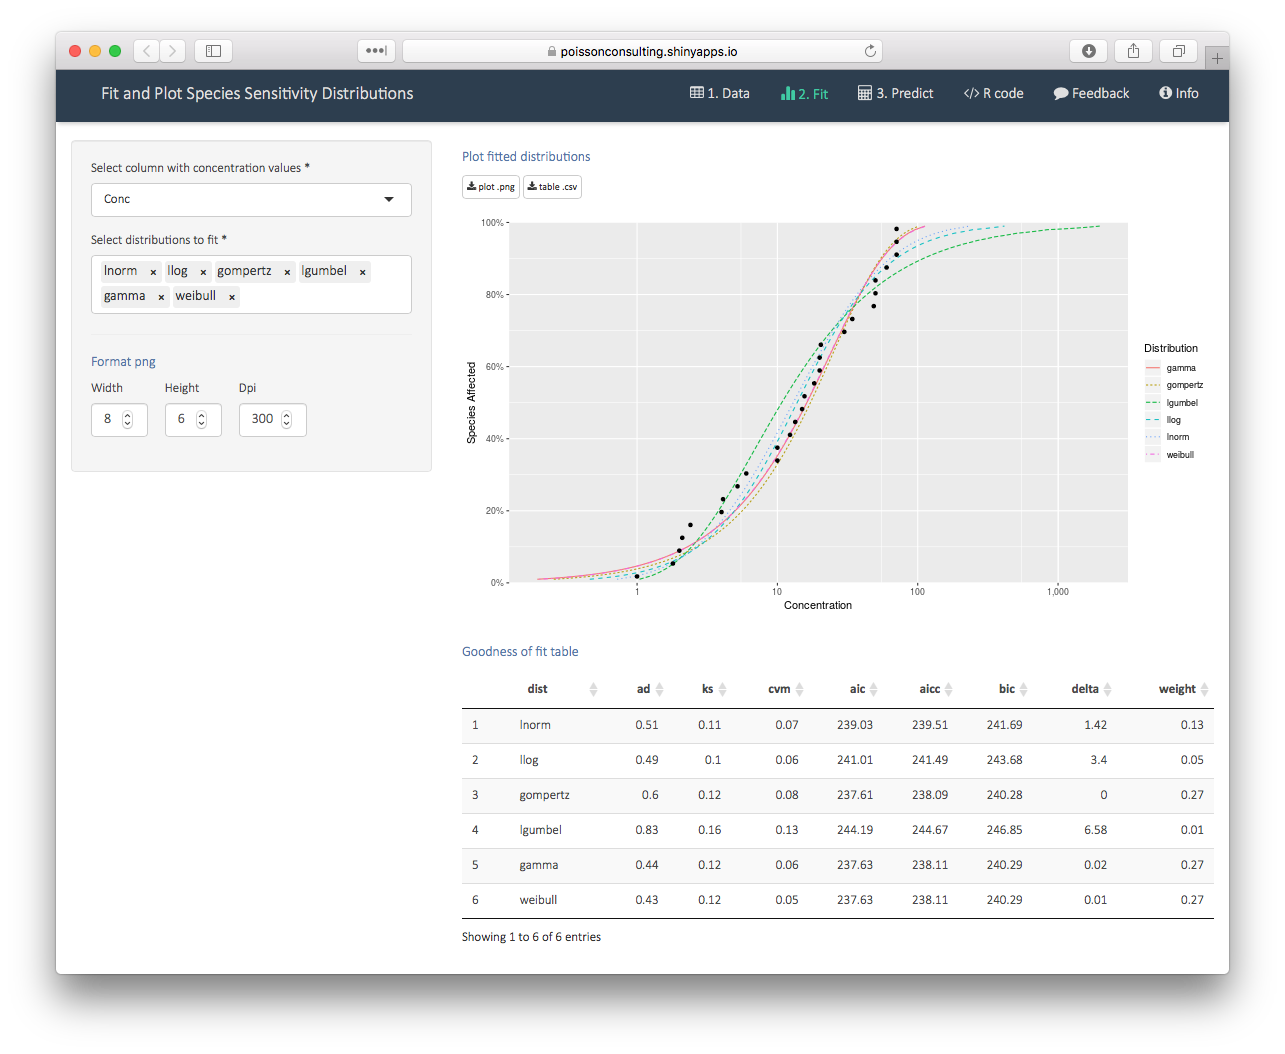
The Species Sensitivity Distributions shiny app is a webpage for interactively fitting species sensitivity distributions to concentration data. The user is able to select more than one distribution and plot the individual fits.
The calculations are performed by the ssdtools R package, which also generates the plots and tables. The shiny app also provides the R code that was used to perform an analysis so the user can replicate it using an R script.

The app was developed for the Ministry of the Environment, British Columbia.
The app can be viewed at https://bcgov-env.shinyapps.io/ssdtools/.
Citation
To cite package ssdtools in publications use:
Thorley, J., and Schwarz, C. 2018. ssdtools: An R package to fit Species Sensitivity Distributions. JOSS 3(31): 1082. doi:10.21105/joss.01082.
To cite the web app use:
Dalgarno, S. 2021. shinyssdtools: A web application for fitting Species Sensitivity Distributions (SSDs). JOSS 6(57): 2848. doi:10.21105/joss.02848.