What are s-values?
P-values are a common measure of statistical significance that are often misunderstood.
One issue is that the scale of p-values can be difficult to interpret. For example, small p-values such as 0.0001 and 0.00001 are easily confused, and many readers often convert p-values to fractions ($\frac1{100}, \frac1{1,000}, \frac1{10,000}$), rounding them in the process (e.g., $0.0103 \approx 0.01 = \frac1{100}$).
S-values address the issue of interpretability by converting probabilities (including p-values) into a more tangible representation: the number of heads in a row on a fair coin.
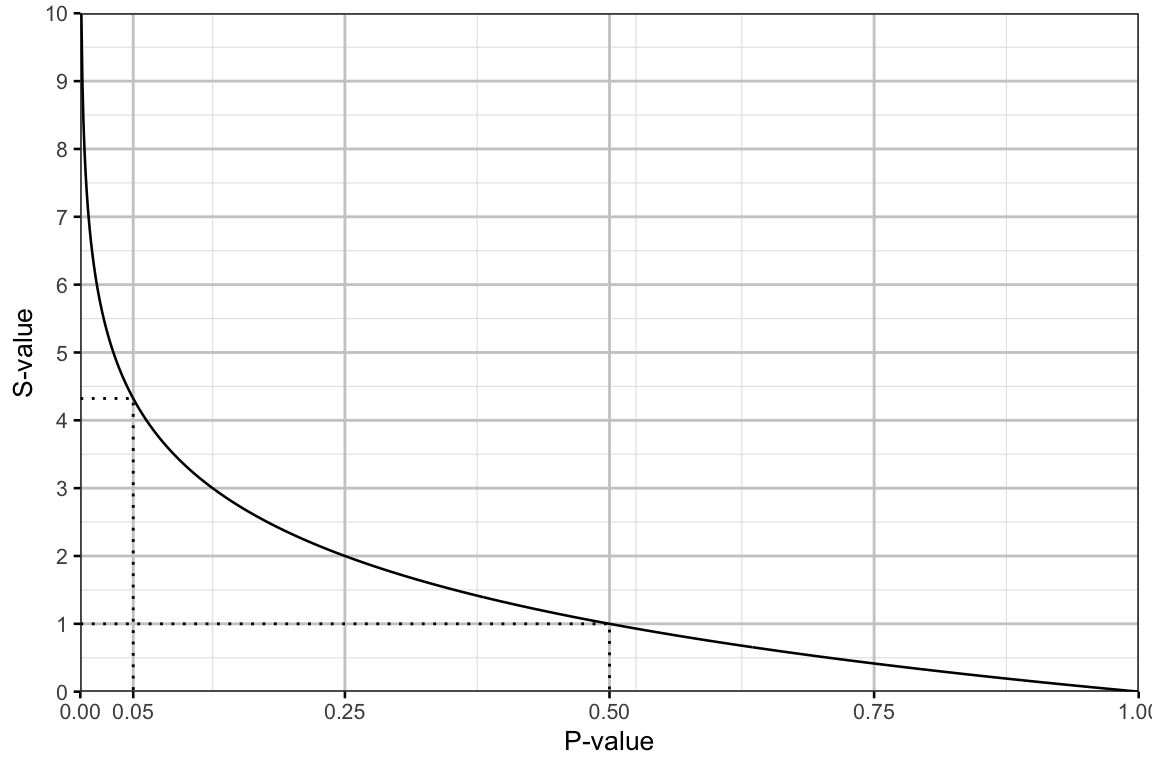
Figure 1 shows the relationship between s-values and p-values. A p-value of 0.5 corresponds to an s-value of 1, since a probability of 0.5 corresponds to a single successful coin flip. Similarly, the common significance cutoff of 0.05 is equivalent to flipping 4.32 heads in a row.
S-values are particularly convenient when comparing or evaluating p-values that are very small or correspond to difficult fractions. See Table 1 below for some examples.
| P-value | Fraction | S-value |
|---|---|---|
| 0.5000000 | 1 / 2 | 1.00 |
| 0.2500000 | 1 / 4 | 2.00 |
| 0.1000000 | 1 / 10 | 3.32 |
| 0.0625000 | 1 / 16 | 4.00 |
| 0.0500000 | 1 / 20 | 4.32 |
| 0.0100000 | 1 / 100 | 6.64 |
| 0.0058366 | 3 / 514 | 7.42 |
| 0.0010000 | 1 / 1000 | 9.97 |
| 0.0001000 | 1 / 10000 | 13.30 |
| 0.0000010 | 1 / 1e+06 | 19.90 |
Stefano Mezzini
Intermediate Computational Biologist
Stefano’s expertise includes time series analysis, remote sensing, and animal movement behaviour.
Joe Thorley
Senior Computational Biologist
Joe’s expertise includes Bayesian analysis, R software development and fish population ecology.